
Node-RED
If you use Node-RED (the visual programming tool built into your controller) to create automations, you may need to consult data recorded in the past.
By default, Node-RED only sees “real-time” data. This official Hexa-AI module adds a new component (a node) to Node-RED, called DataPlug History, which queries the controller’s historical database directly and extracts ready-made statistics from it (averages, minimum, maximum and so on).
Prerequisites
Section titled “Prerequisites”-
The HAI-P200-4G controller running HAI-OS.
-
The Node-RED application enabled, from the controller’s Add-ons page.
-
Data recording enabled in the Data-Plug (Historization ON).
Installing the module
Section titled “Installing the module”Adding this module to your Node-RED environment is very simple:
-
Open the Node-RED interface (from the Add-ons menu, or by typing https://
/nodered in your browser). -
Click the main menu (the three horizontal bars at the top right).
-
Click Manage palette.
-
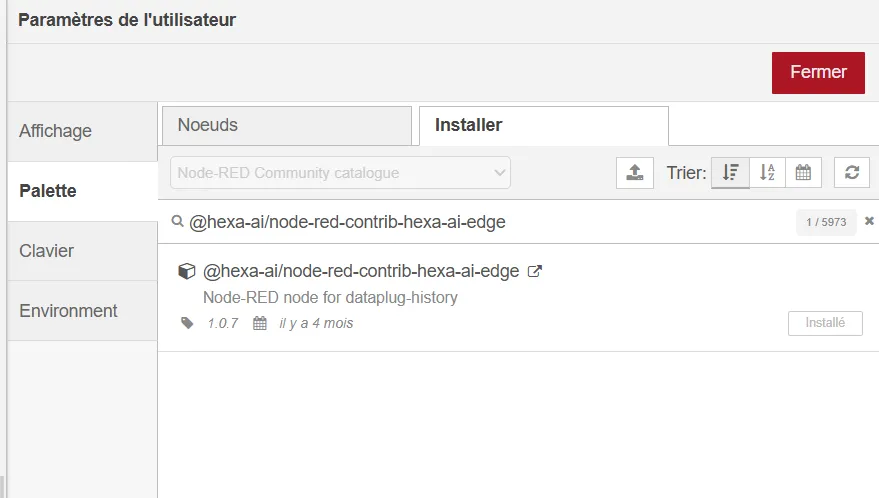
Go to the Install tab.
-
In the search bar, type: @hexa-ai/node-red-contrib-hexa-ai-edge
-
Click the Install button next to the result.
What is the DataPlug History node for?
Section titled “What is the DataPlug History node for?”This node fetches data from the controller’s archives intelligently:
-
Transparent partitions: since data is filed by month in memory, the node looks in the right “drawers” by itself, according to the date requested.
-
Automatic enrichment: it does not just bring back raw figures. It automatically attaches the metadata (units, description, category) from your Data-Plug configuration.
-
Built-in calculations: you can ask it to compute hourly averages, minimums per minute, or differences directly (very handy for energy meters!).
Configuring the node
Section titled “Configuring the node”Drag the DataPlug History node into your workspace and double-click it to configure it. Here are the available settings:
-
Name: to give your node a clear name on the diagram.
-
Channels: the exact name (or names) of the variables you want to query (Tank_Temperature, for example). To ask for several, separate them with commas.
-
Time Range: the window to analyse — Last 15 minutes, Last hour, Last 6 hours, Last 12 hours, Last 24 hours, Last 2 days, Last 7 days, Last 30 days. The first entry in the list, Use input message (msg.payload.from/to), lets the flow decide (see Dynamic input).
-
Aggregation: the operation applied within each interval — Average, Minimum, Maximum, or Difference (Counters). This setting only has an effect if Interval is Per Minute, Per Hour or Per Day. It is ignored for None (Raw Data) and Last Value Only. Difference (Counters) computes the gap between the largest and the smallest value of the interval. That is exactly the consumption of a meter that only counts up; if the meter is reset or drops back to 0 during the interval, the result is the amplitude, not the consumption.
-
Interval: the grouping step — Per Minute, Per Hour, Per Day. Groups are cut in UTC: a day runs from 00:00 to 24:00 UTC, which is one or two hours off local time. The timestamp returned for a group is that of its first point. Choose None (Raw Data) to get every recorded point, with no grouping, or Last Value Only for just the last known value of each variable over the period.
-
Category: restricts the search to one kind of variable — Measure, State, Counter or Alarm. Combined with the Channels field, it acts as a filter: a variable listed in Channels that does not belong to the chosen category is not returned. Left on None, only Channels counts. Conversely, Category alone with Channels empty queries every variable of that category. If both are empty, the node emits no message and reports “No channel or category specified”.
Inputs and outputs
Section titled “Inputs and outputs”The node fires as soon as it receives a message (a “tick”) on its input, and puts the result out on its output.
Dynamic input (optional)
Section titled “Dynamic input (optional)”If you want Node-RED to decide the period to query itself (rather than using the node’s fixed configuration), you can send it a msg.payload object structured as follows:
-
msg.payload.channels: an array of the variable names ([“Temp1”, “Pressure2”], for example).
-
msg.payload.from: the start date (in milliseconds since 1970 — a timestamp).
-
msg.payload.to: the end date (in milliseconds).
How to read min, max and avg
Section titled “How to read min, max and avg”Those three values are computed on the points the node returns, that is after aggregation. With Interval = Per Hour and Aggregation = Average, min is the smallest of the hourly averages, and avg is the average of those averages — not the minimum nor the average of the raw data.
To get the true extremes over the period, set Interval to None (Raw Data): the node then goes through every recorded point, and min / max are those of the measurement itself.
Output structure
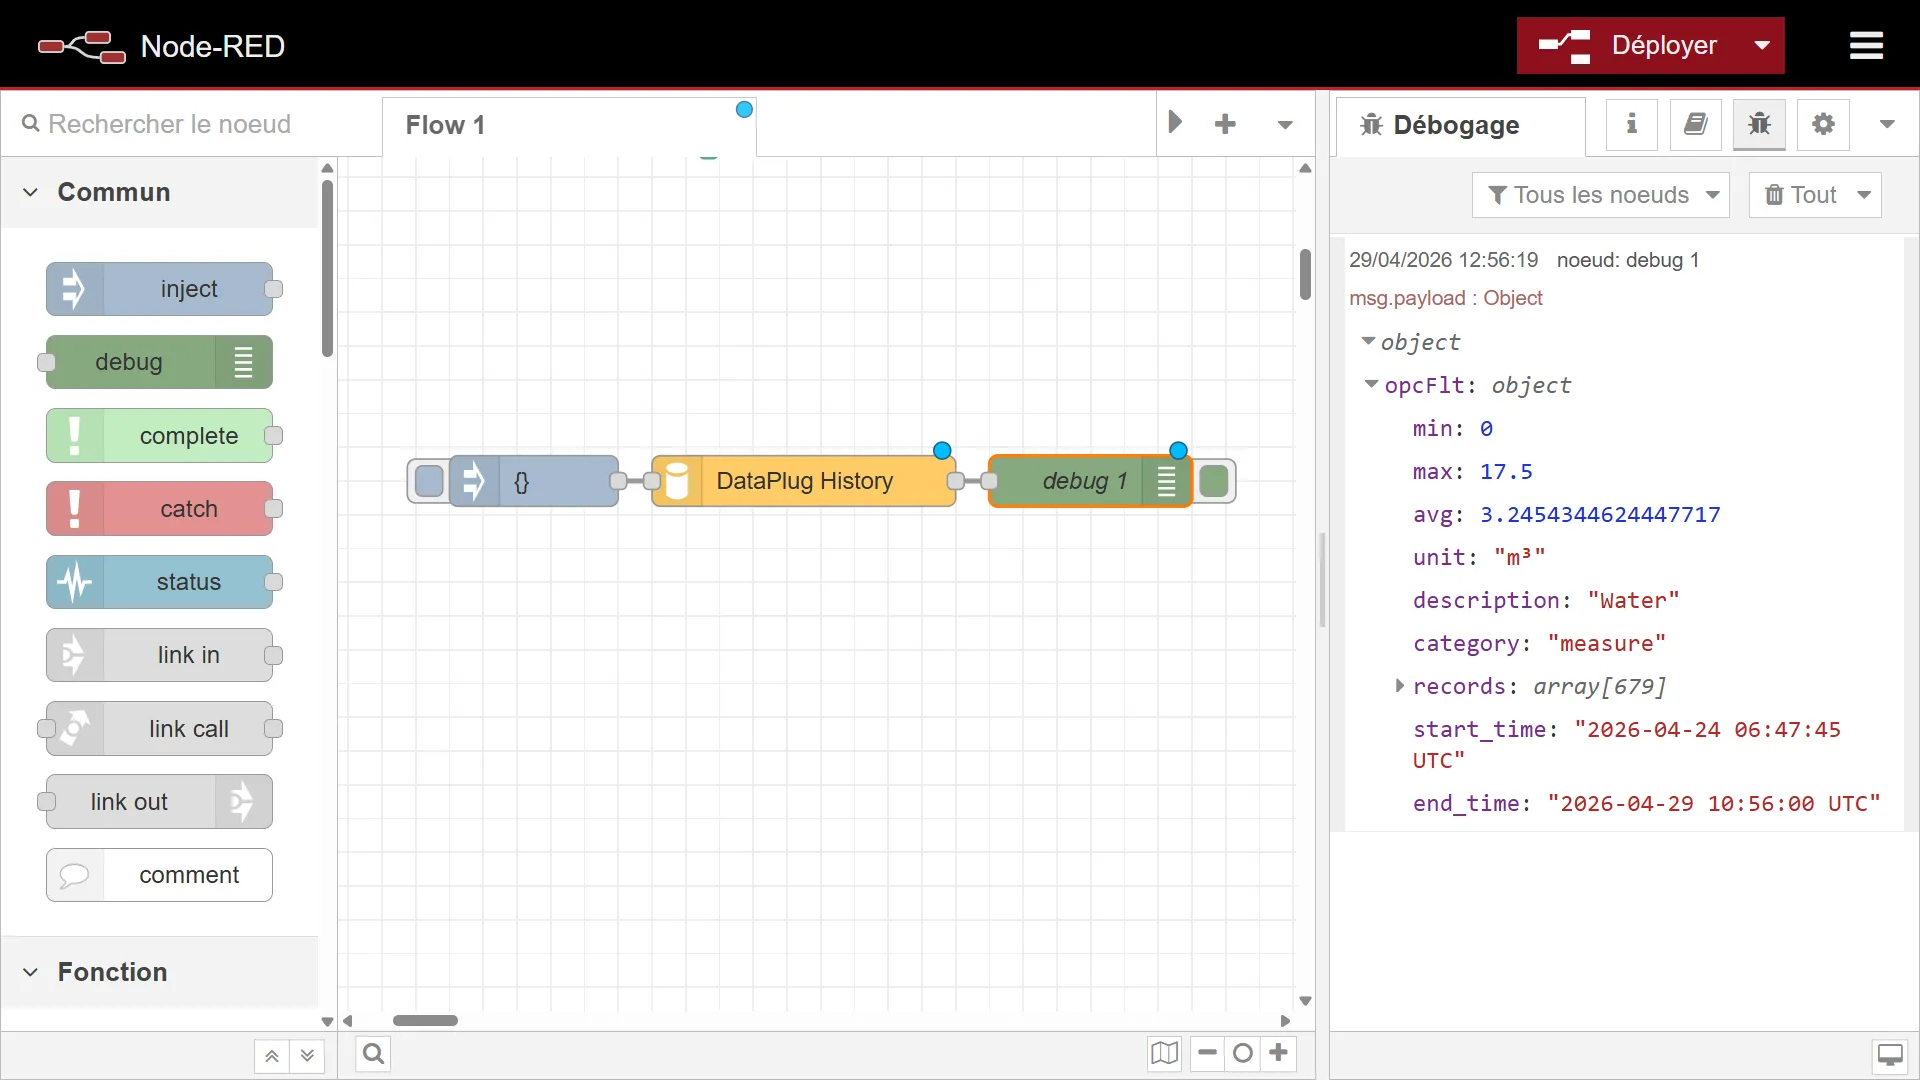
Section titled “Output structure”Once the database search is finished, the node emits a message. The msg.payload contains a JavaScript object where each requested variable has its own summary:
JSON
{ "Tank_Temperature": { "min": 15.2, "max": 24.8, "avg": 19.5, "unit": "°C", "description": "Main temperature of the mash tun", "category": "measure", "start_time": "2026-04-27 08:00:00 UTC", "end_time": "2026-04-28 08:00:00 UTC", "records": [ { "ts": 1745678000000, "value": 15.2 }, { "ts": 1745681600000, "value": 16.1 } // ... further points, generated according to the chosen interval ] }}The node always emits a message, even with no result: msg.payload is then an empty object {}. Plan for that case in your flow rather than expecting an error.
Only numeric values are returned: a text variable appears with no usable value.
You can then use that result easily in the rest of your Node-RED flow (to display it on a dashboard, send it to another system, raise an alert and so on).
Node-RED moving to non-root
Section titled “Node-RED moving to non-root”Version 1.3.8 runs Node-RED as an ordinary user, which breaks two things: a flow can no longer listen on a port below 1024 (a Modbus/TCP server on 502 has to move to 1502 — querying a device on port 502 is unaffected), and exec nodes are no longer administrator.