Notifications
The Notifications and Reports system turns the raw data collected by the Data-Plug into usable information. It alerts operators in real time when something goes wrong, and generates automatic periodic reports (by e-mail) about your installations.
Prerequisites
Section titled “Prerequisites”-
The HAI-P200-4G controller
-
HAI-OS
-
Variables configured in the Data-Plug (variables of the Alarm category for the alerts, and variables marked as Favourites (⭐) for the reports).
Enabling and configuring sending (SMTP)
Section titled “Enabling and configuring sending (SMTP)”To use this module, you first have to turn on the global Enable notifications switch at the top of the page. Then you have to configure the mail server (SMTP) the controller will use to send the e-mails.
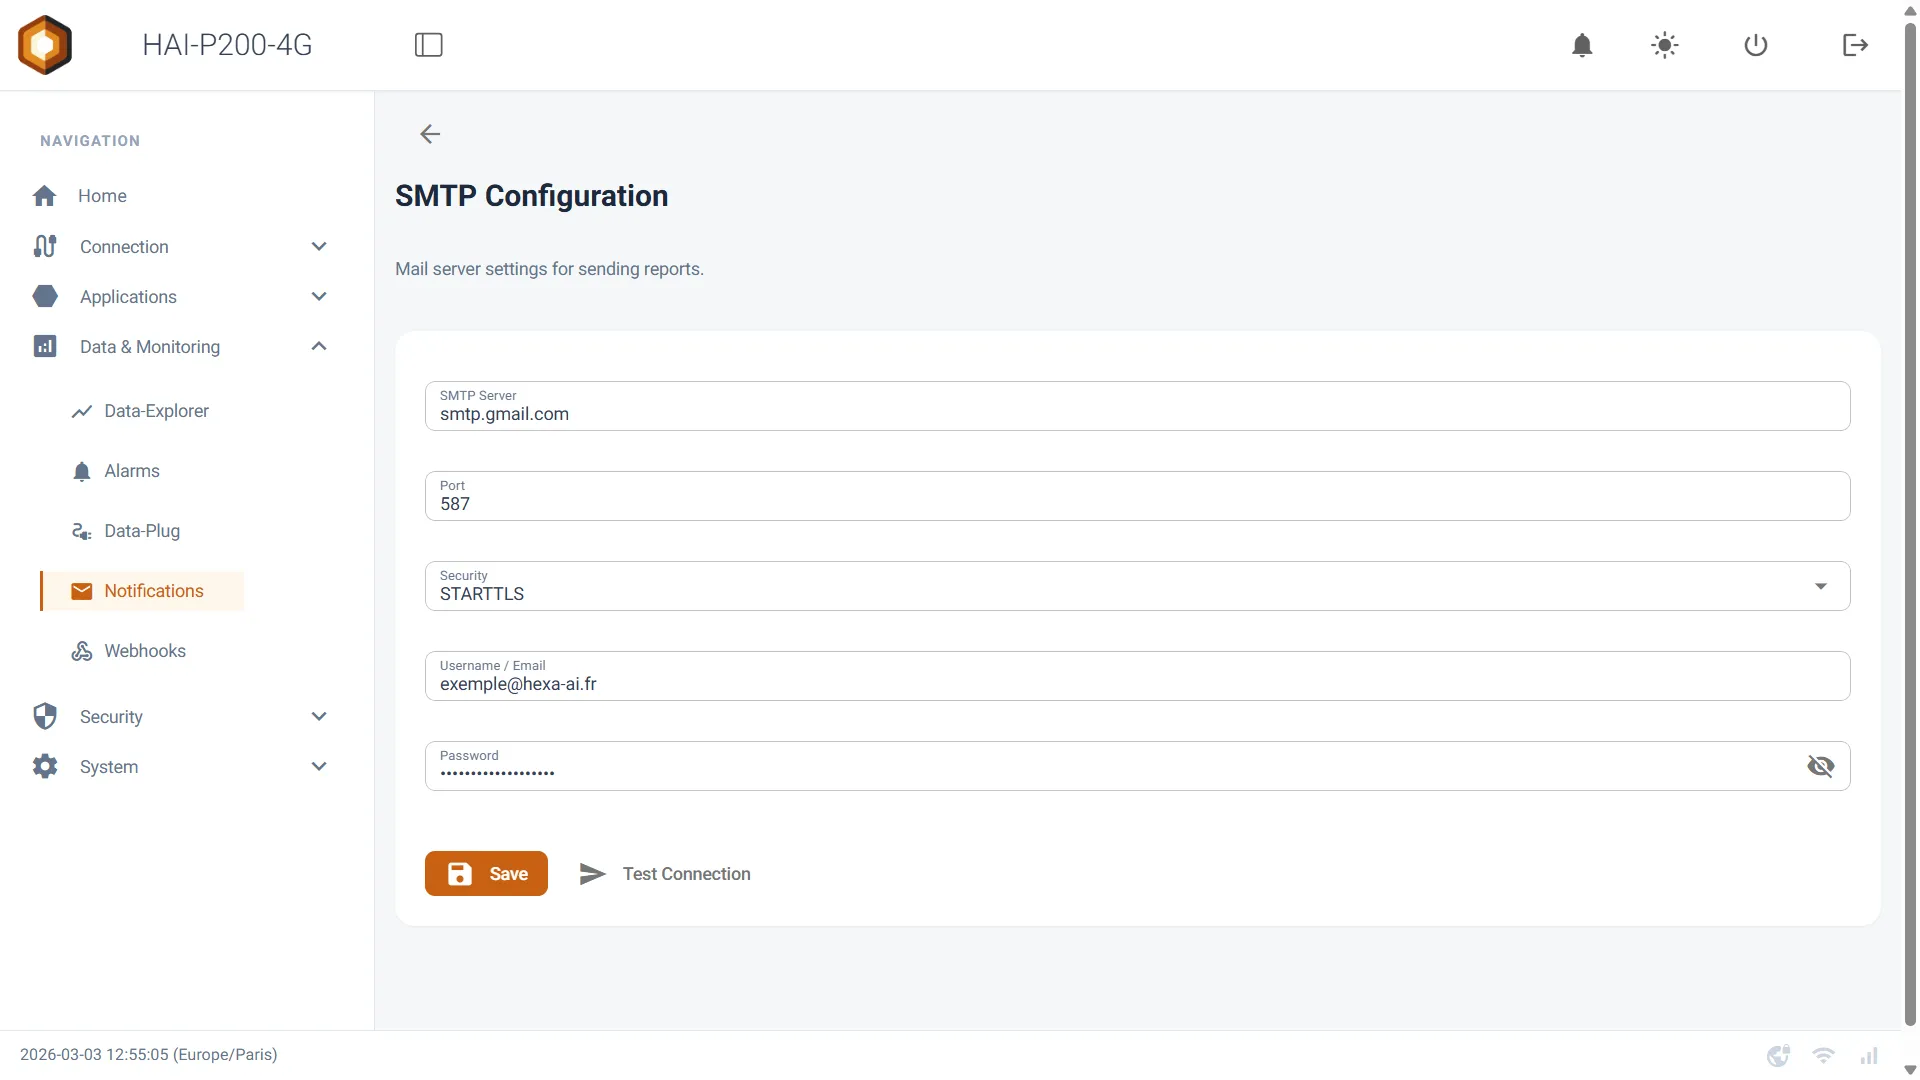
Click the SMTP Configuration button to reach the settings:
-
SMTP Server & Port: your mail server’s address (smtp.gmail.com, for example) and its port (usually 587 for STARTTLS or 465 for SSL).
-
Security: select the security mode (STARTTLS, SSL or NONE).
-
Username, From Email Address & Password: the SMTP account’s user name, the sending e-mail address (which may differ from the user name depending on the provider), and the matching password.
Managing recipients
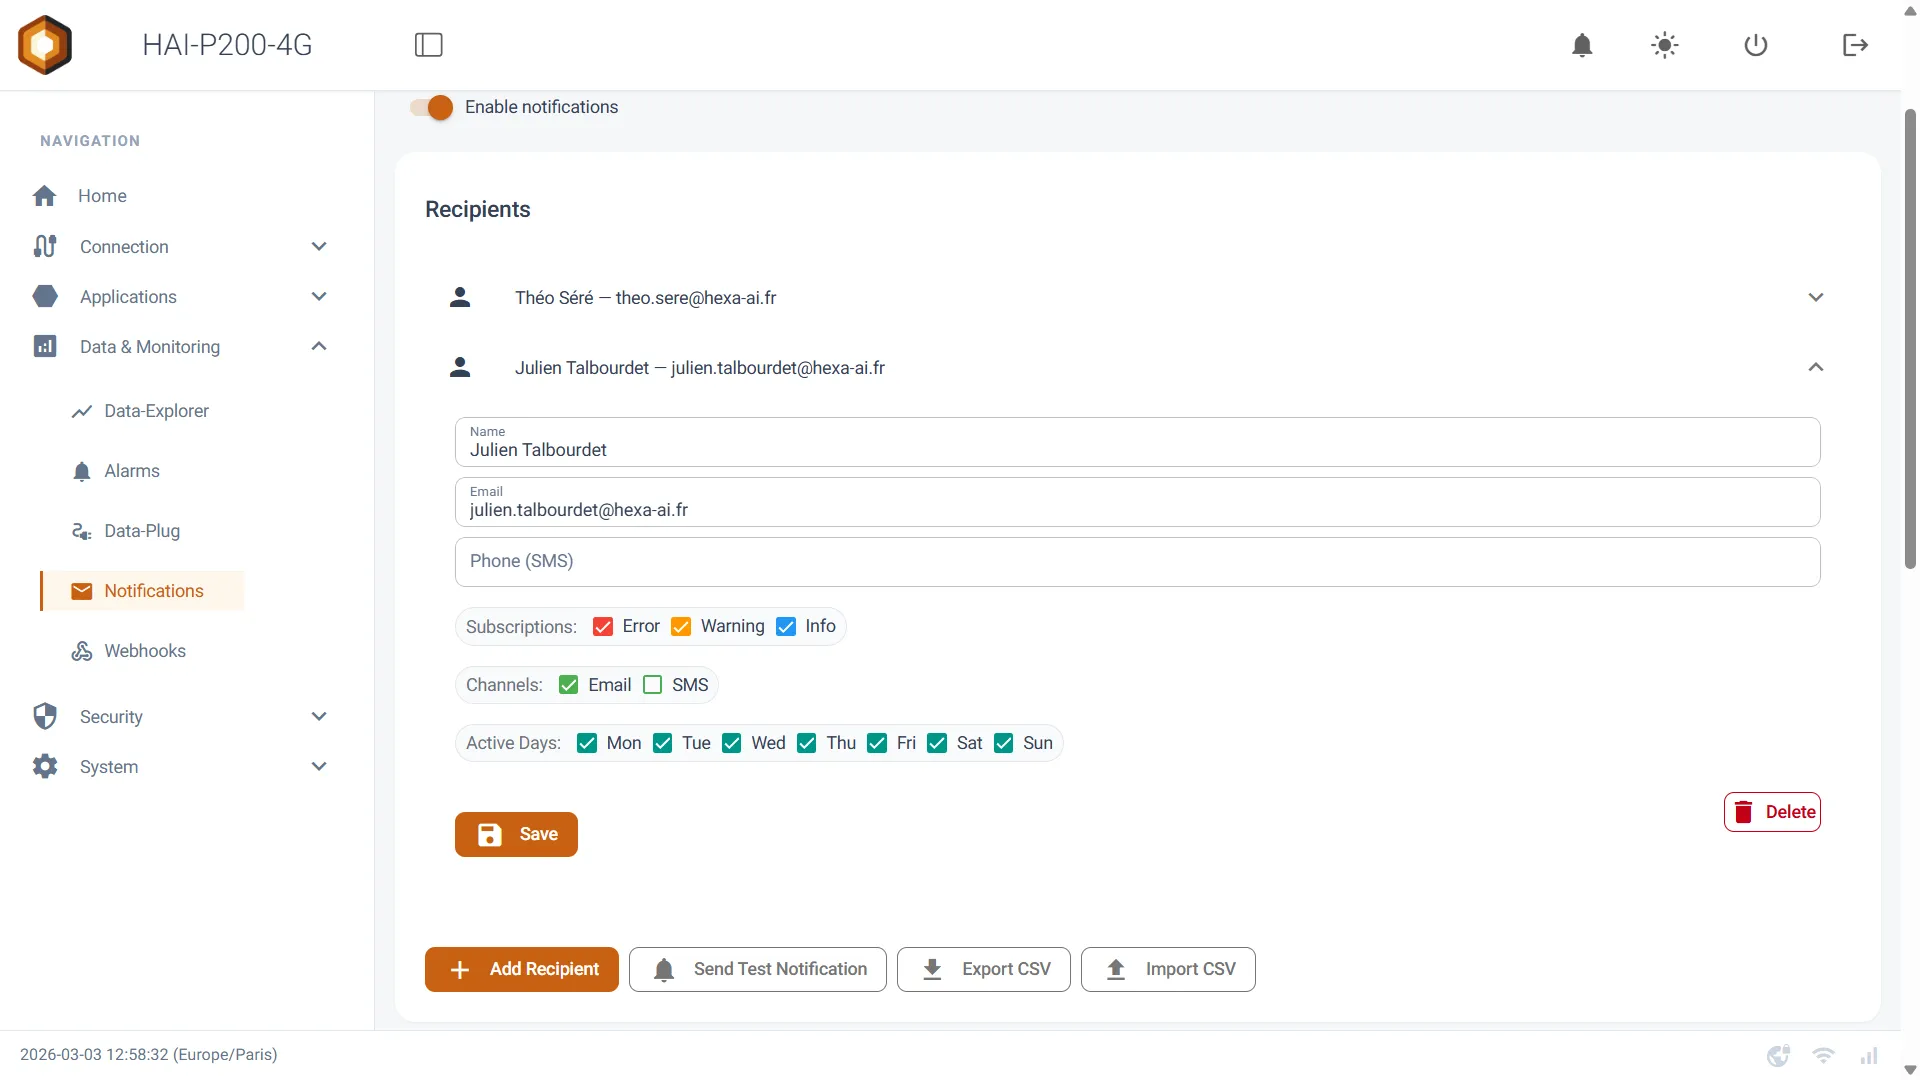
Section titled “Managing recipients”The Recipients section builds the list of contacts (individuals or groups) who will receive the alerts and the reports. Click Add Recipient to create a new entry.
For each contact, you can configure:
-
Name & Email / Phone: the contact’s identity and their details (for e-mail and SMS).
-
Subscriptions: tick the alarm levels (Error, Warning, Info) this contact is allowed to receive.
-
Channels: choose how the contact can be reached — E-mail, SMS and/or Call. The Call box is a permission: a call is only placed when an escalation tier asks for one, never on a simple notification.
-
Active Days: select the days of the week on which this contact will receive notifications (handy for managing on-call rotas).
How alarm notifications work
Section titled “How alarm notifications work”Unlike other systems, you do not have to create complicated alarm rules on this page. The system relies natively on the Data-Plug.
-
As soon as a variable configured in the Alarm category in the Data-Plug goes Active (1), the system detects it instantly.
-
It matches that alarm’s severity (Error, Warning or Info) against your recipients’ Subscriptions.
-
It sends the alert!
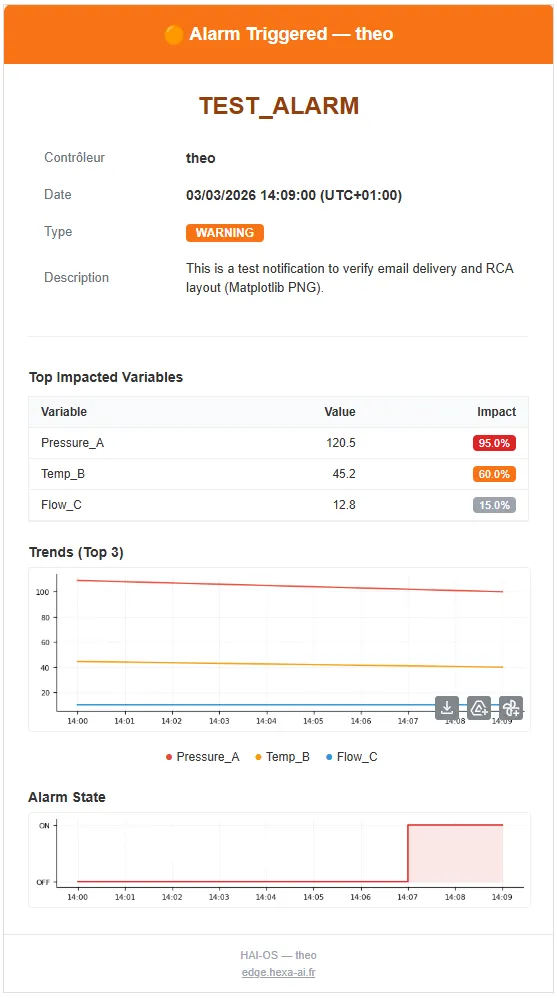
Built-in Root Cause Analysis (RCA): when an alarm fires, the e-mail sent does not just warn you. It automatically includes a smart analysis (RCA) showing, in a table, the top 5 variables (measurements) that varied the most just before the alarm fired, together with a trend chart centred on the three main ones — to help you diagnose the problem before you even log in to the controller.
The RCA computation can be disabled individually for a given alarm variable (the “Compute RCA” option in the variable’s configuration, at the Data-Plug level). If it is disabled, the alarm e-mail is sent as usual but without the root cause analysis table or charts.
That is how immediate notification works. If you enable escalation for a given alarm level, alarms of that level are no longer sent that way: they follow the chain of tiers (see Escalation).
Example of a notification
Escalation (tiers)
Section titled “Escalation (tiers)”By default, an alarm is notified immediately to every recipient whose subscription matches its level. Escalation replaces that behaviour with a chain: a first group is contacted, and if nobody responds, the next one takes over.
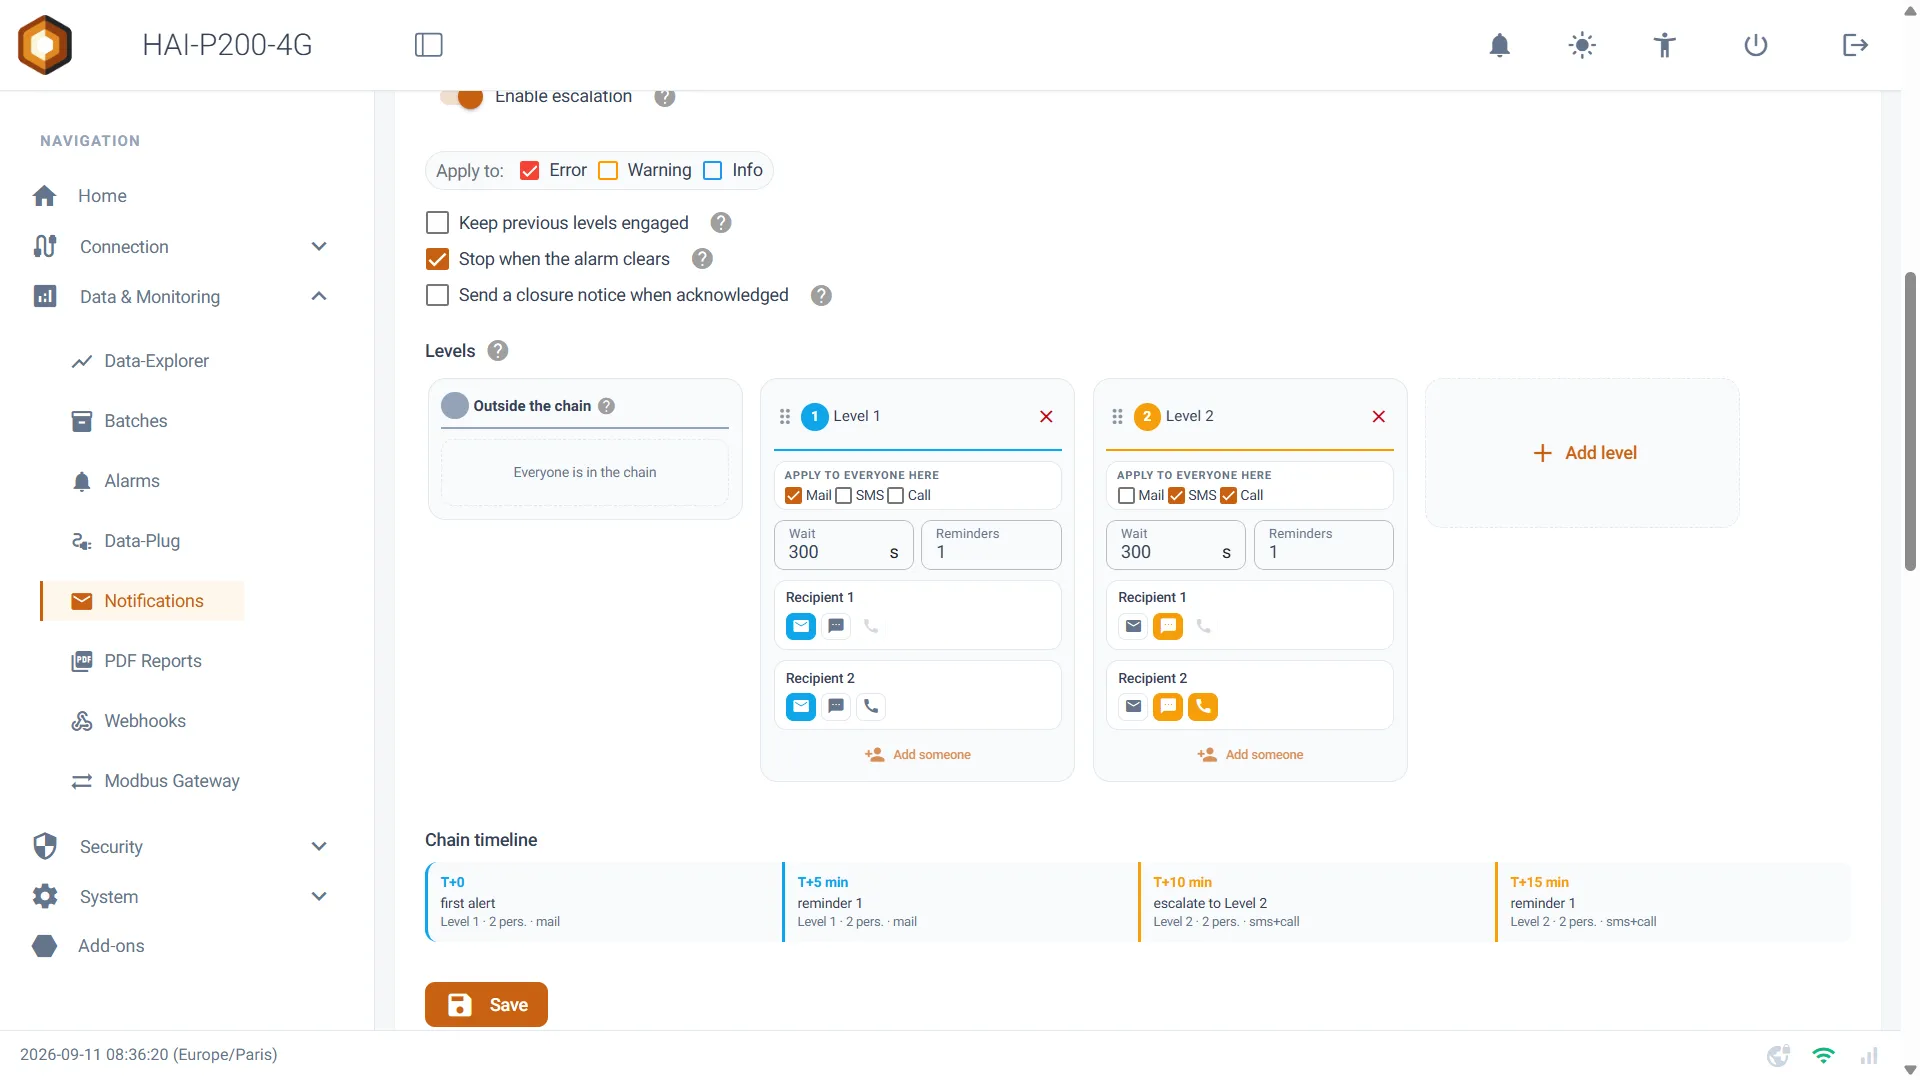
Turn on the Enable escalation switch to reveal the configuration.
An important point: escalation replaces immediate notification, it does not add to it. An alarm handled by the chain only goes out through the chain — a recipient who is on no tier is not contacted at all. The alarm levels you leave unticked in Apply to, on the other hand, are still sent immediately to everyone.
The chain’s scope and options
Section titled “The chain’s scope and options”- Apply to: the alarm levels entrusted to the chain (Error, Warning, Info). By default, Error only.
- Keep previous levels engaged: once tier 2 is reached, tier 1 keeps receiving the reminder messages.
- Stop when the alarm clears: the chain stops by itself if the alarm goes back to inactive before anyone has acknowledged it.
- Send a closure notice when acknowledged: everyone already contacted is told who took the incident on.
Building the tiers
Section titled “Building the tiers”Tiers are configured on a table of columns, using drag and drop:
- Add someone places a person on a tier. The same person can appear on several tiers — that is how you reach them by SMS on the first one, then by call on the third.
- Drag a card from one column to another to move someone, and click the card’s ✕ (or drag it out of the table) to remove them from the chain. The ⠿ handle at the head of a column reorders the tiers.
- The ✉ / 💬 / 📞 icons on each card choose the channels used for that person on that tier. The boxes at the top of a column are a bulk action: they enable or disable a channel for every card on the tier, and each card can still be adjusted afterwards.
- Wait: the delay before moving to the next tier (300 seconds by default, 10 minimum). Reminders: the number of reminders sent within the tier before escalating.
- The Outside the chain area lists the recipients who are on no tier. They will not receive the alarms covered by escalation.
A Chain timeline strip below the table sums up how things unfold over time (T+0, T+5 min, …), so you can check at a glance that an unhandled incident does eventually escalate, and how long that takes.
Acknowledging
Section titled “Acknowledging”A recipient acknowledges in one of three ways:
- by replying OK to the alert SMS (the sender’s number is enough to identify them, with no code to type);
- by pressing key 1 during the voice call;
- from the acknowledgement button on the Alarms page.
The chain stops immediately. Acknowledging only means “I have seen the alert”: it does not acknowledge the alarm itself, which stays active in the interface and in the reports.
Note: chains in progress are held in RAM. Restarting the application cancels any pending escalations.
The voice call channel
Section titled “The voice call channel”A tier can ring a phone and read the alarm out loud. Two rules of good practice: calls are placed one at a time (the modem only holds one line), so it is better to keep them for the last tiers, once the quieter channels have already gone out; and a recipient’s Call box is only a permission — a call is never placed on a simple notification, only when a tier asks for one. If the call service is not available on the controller, the box is greyed out and the reason is shown.
Rate limiting notifications (throttling)
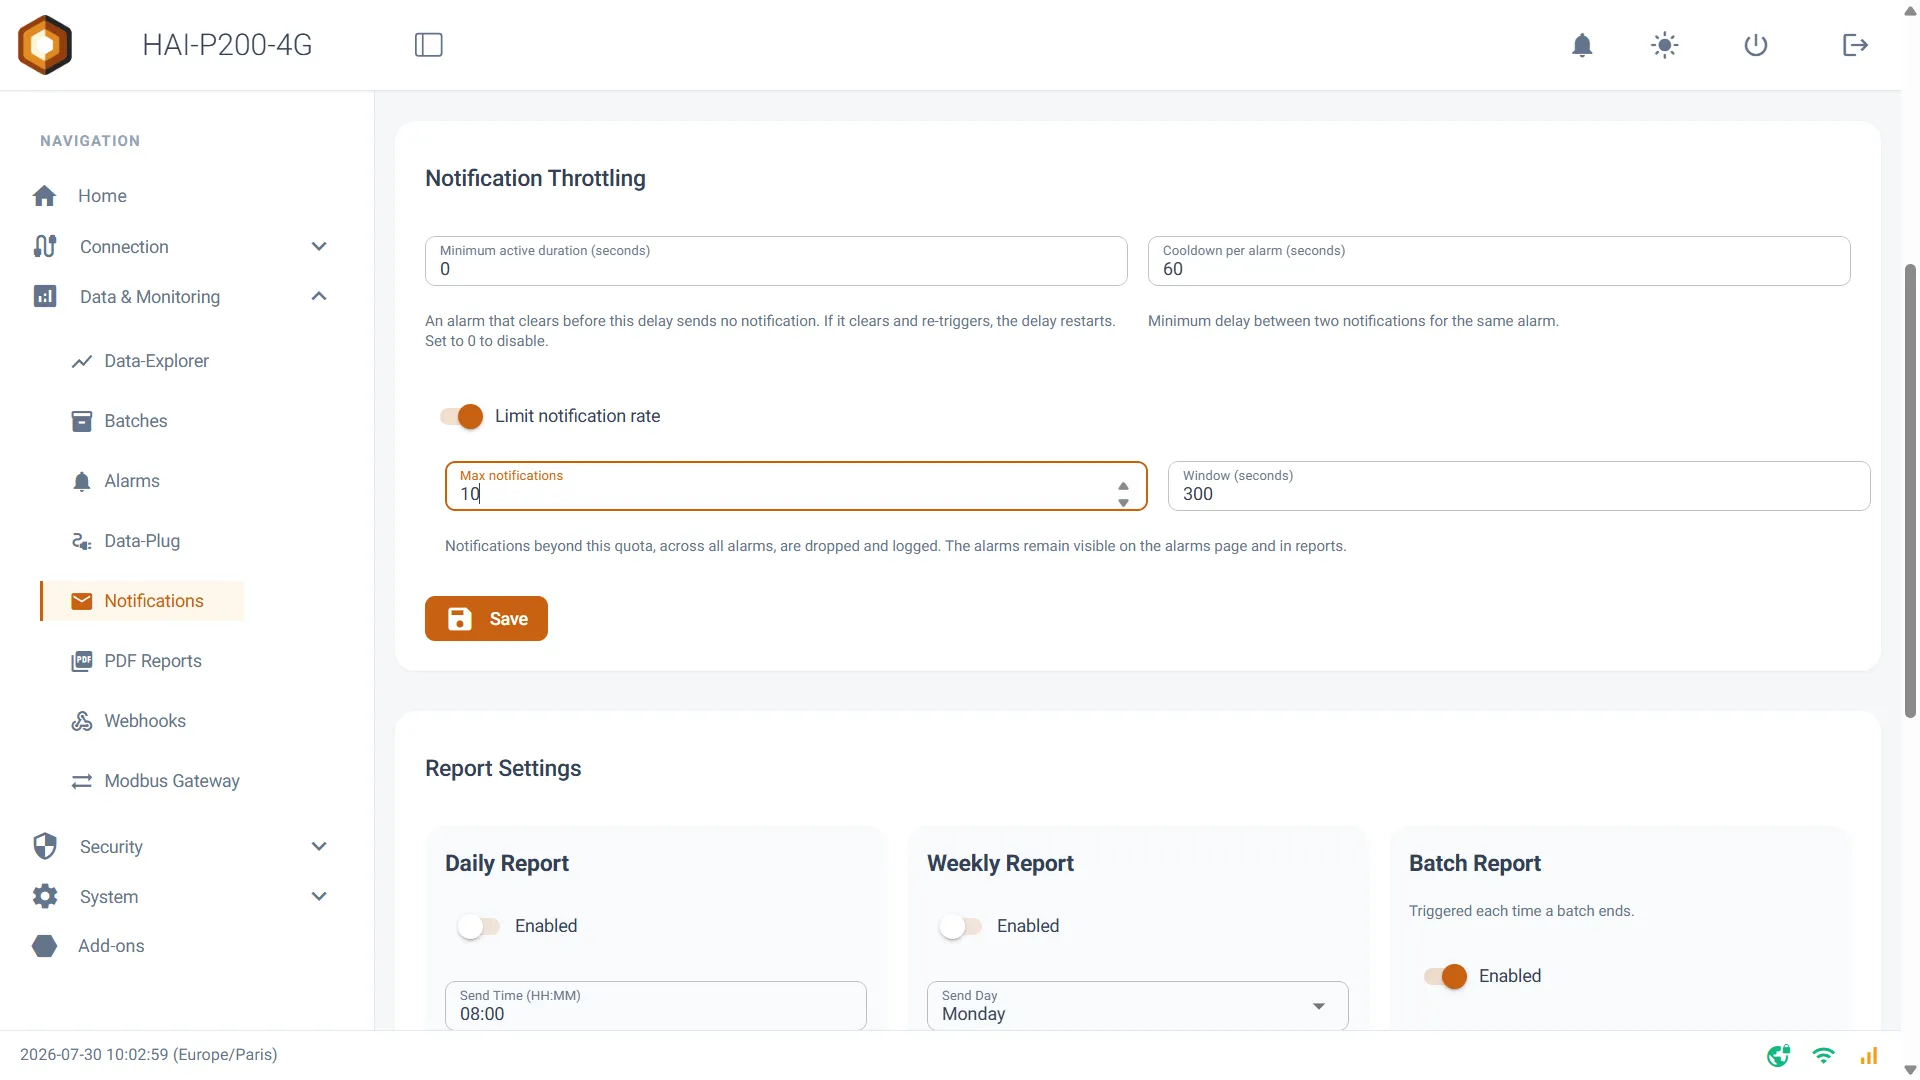
Section titled “Rate limiting notifications (throttling)”To avoid being swamped with notifications during an unstable (“flapping”) alarm or a major incident affecting several variables at once, three limiting mechanisms are available, and they can be combined:
- Minimum active duration (seconds): how long an alarm has to stay active before a notification is sent. If the alarm goes inactive again before that delay is over, no notification is sent. Disabled by default (0 seconds).
- Cooldown per alarm (seconds): the minimum delay between two successive notifications for the same alarm. Default: 60 seconds.
- Limit notification rate: a switch enabling a global limit, across all alarms, on the number of notifications sent over a rolling time window (Max notifications and Window (seconds), 10 notifications / 300 seconds by default). Disabled by default. Beyond the quota, the notification is not sent, but the alarm stays visible on the alarms page and in the reports.
Generating periodic reports
Section titled “Generating periodic reports”The Report Settings section lets you automate the sending of summary reports about your data. Those reports are based exclusively on the variables you have marked as Favorites (⭐) in the Data-Plug.
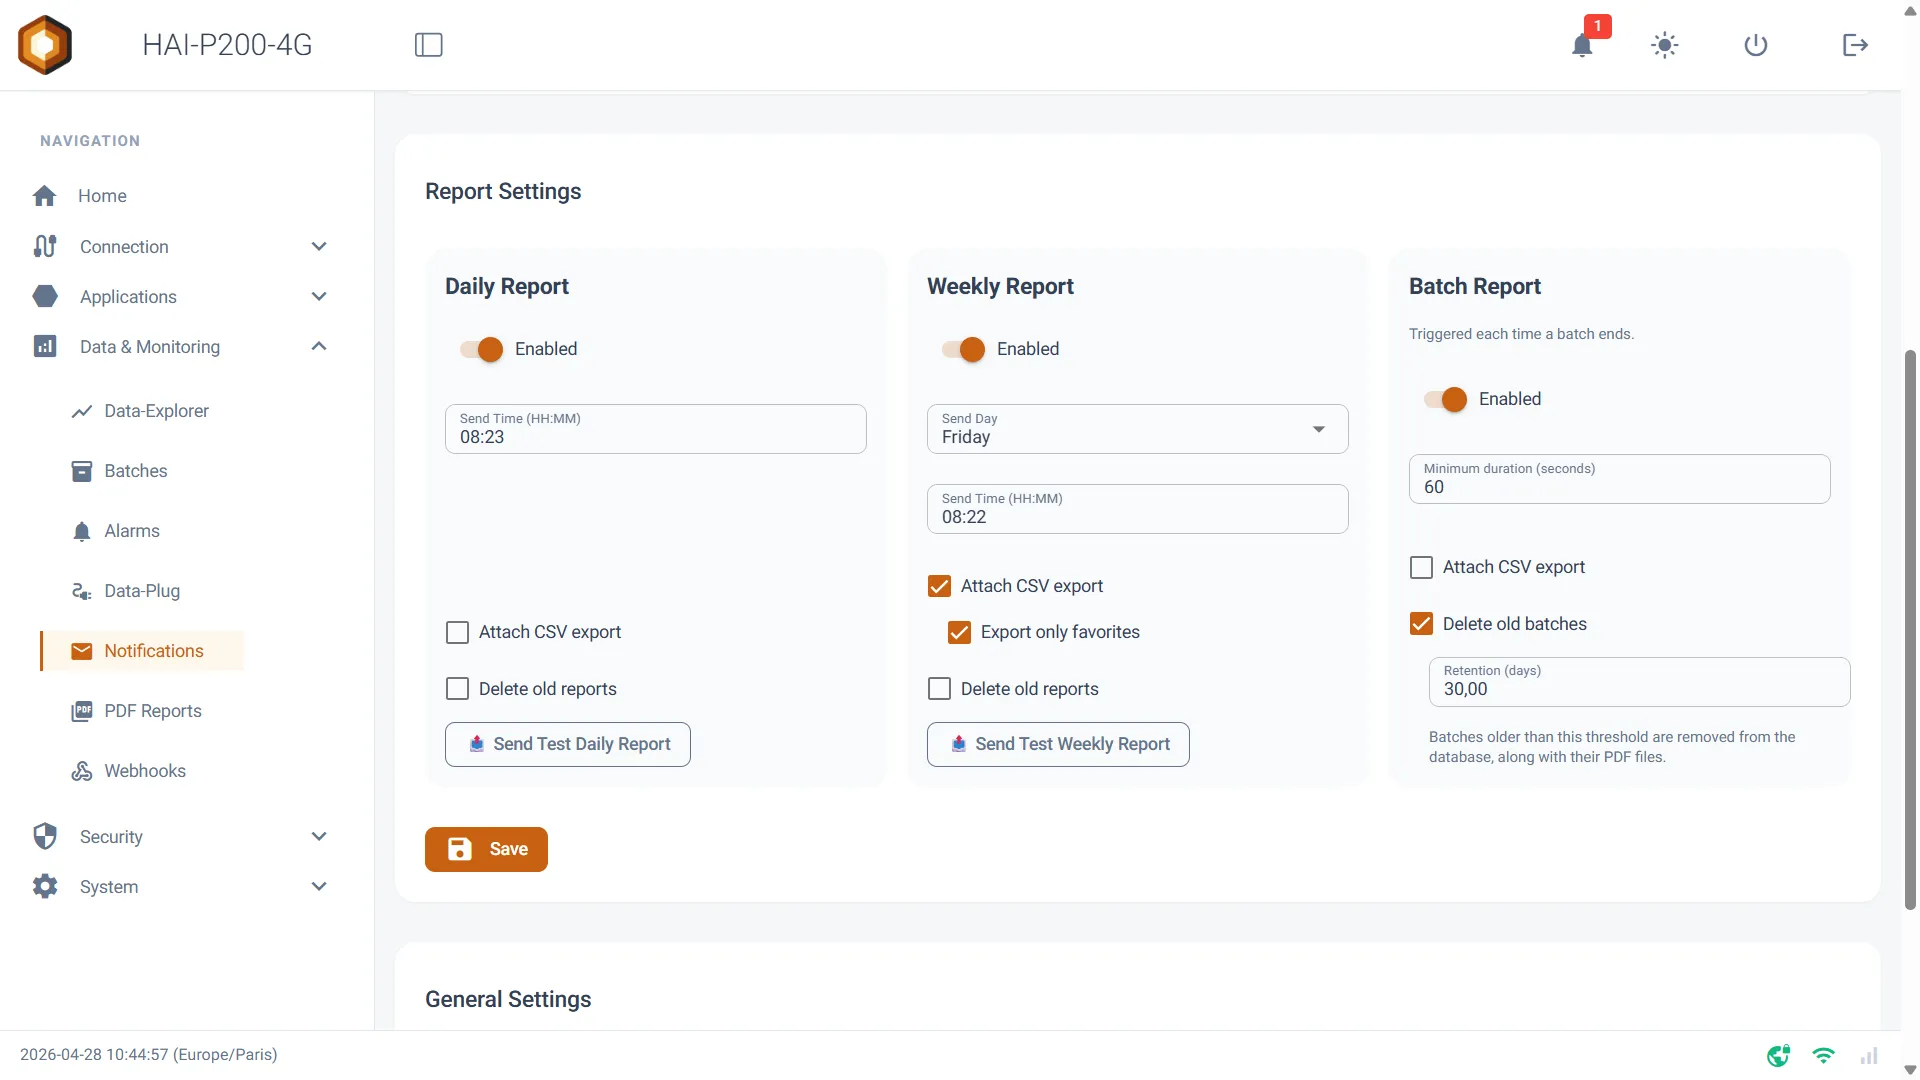
The interface is split into three columns:
-
Daily Report: to receive a summary every day at a set time.
-
Weekly Report: to receive a summary once a week.
-
Batch Report: automatically generates and sends a full report each time a batch ends (as defined by an identifying variable in the Data-Plug). You can set a “Minimum duration (seconds)” there to avoid generating reports for batches that are too short.
For each report type, you can configure:
-
Enabled: turns the sending of this report on or off.
-
Send Time: the sending time.
-
Attach CSV export: if enabled, the controller attaches a CSV file containing the raw data history for the period (handy for archiving it or reworking it in Excel).
-
Export only favorites: if ticked, the CSV file only contains your favourite variables. If unticked, the CSV file contains every variable the controller recorded over the period.
-
Delete old reports / Delete old batches: if enabled, the controller automatically deletes the old reports stored locally.
-
Retention (days): sets how long they are kept (in days). For Daily/Weekly reports, this only deletes the old PDF files. For Batch reports, it deletes the batch’s identification history along with its PDF, but the raw measured data stays intact (its retention is managed separately, by the Data-Plug configuration).
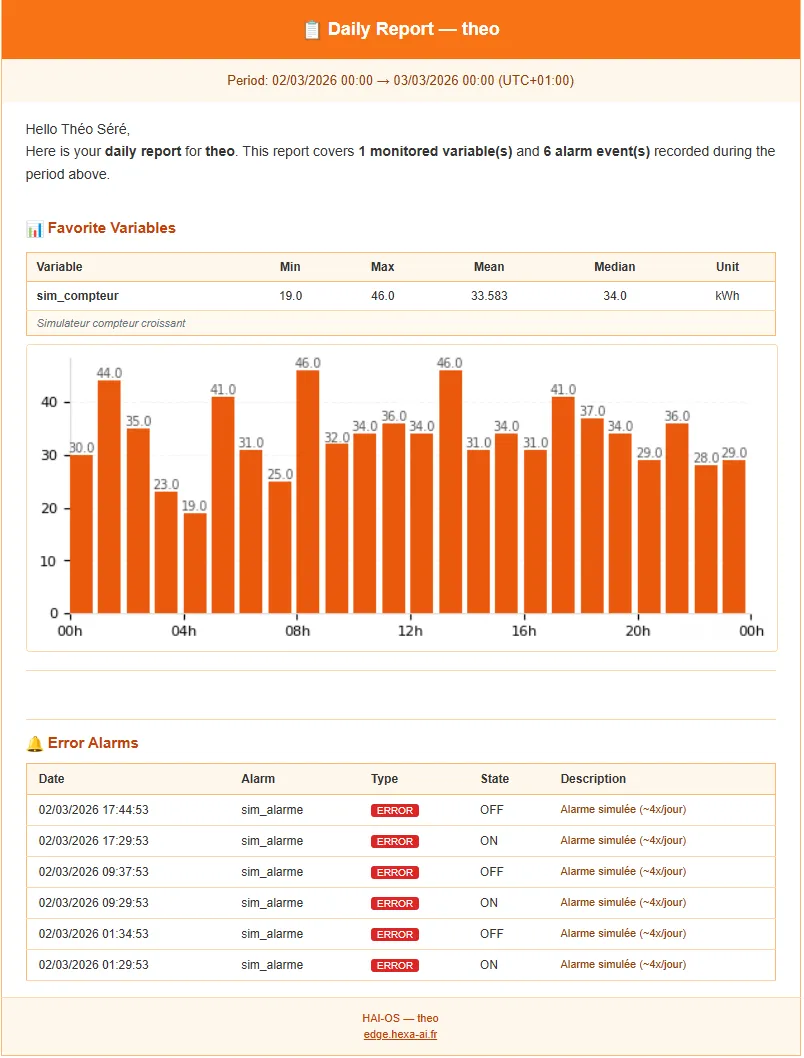
The report e-mail (in HTML format) contains a summary table with the statistics (Min, Max, Average) and the charts of your first 5 favourite variables in alphabetical order, along with a history of the alarms that fired over the period.
A favourite variable in the Position category whose Map in reports option is enabled in the Data-Plug appears as a map with the track travelled over the period, instead of a curve. The map background is downloaded at generation time; with no Internet, the track is still drawn, on a neutral background.
Example of a report
The generated reports are archived on the controller and can be consulted from the PDF Reports page: filtering by type and by date, viewing in the browser, downloading and deleting, including in bulk.
General configuration (time zone)
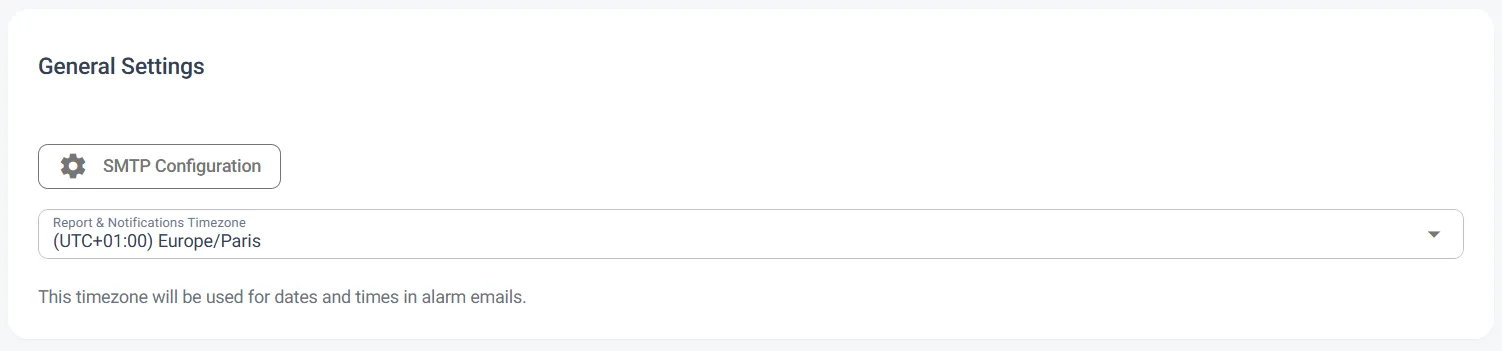
Section titled “General configuration (time zone)”The General Settings section holds one crucial parameter: the time zone.
Make sure you select the right one (Europe/Paris, for example). This setting guarantees that your reports’ sending time and the timestamps shown in the alarm e-mails match your local time.